The Observability Gap: What Most Engineering Teams Don't Measure Until It's Too Late
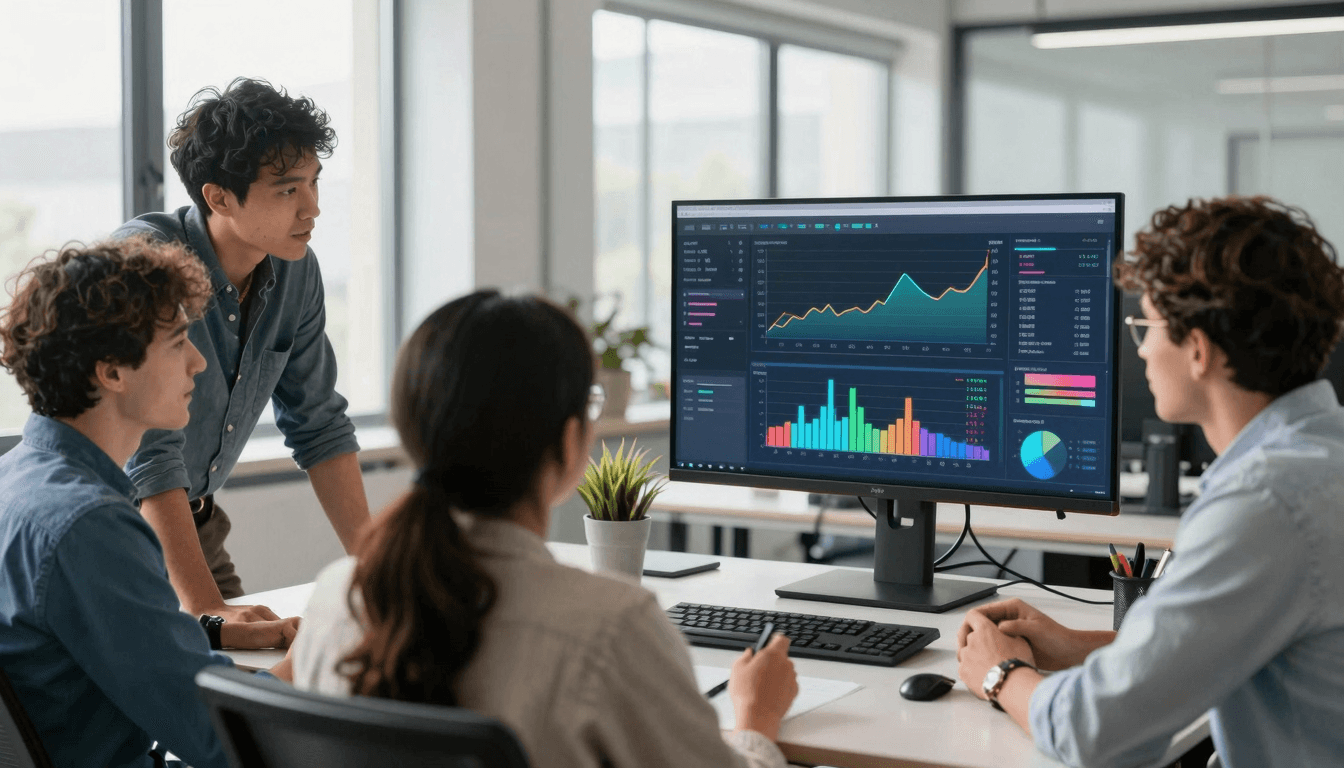
Most engineering teams find out they have an observability problem at 3 a.m., when a pager goes off, a dashboard shows everything green, and nobody can explain why customers are seeing errors. AEGONTECH LLC has walked into that exact situation with more than one client: a system that looked healthy by every metric it happened to be tracking, while the metric that actually mattered was never instrumented in the first place. That gap — between what teams monitor and what they can actually explain — is the subject of this post, and it is far more common, and far more expensive, than most technical leaders assume.
Key Takeaways
- Monitoring tells you that something broke; observability tells you why — and most teams only have the first one.
- According to Gartner, unplanned IT downtime costs enterprises an average of $5,600 per minute, which means even a 20-minute blind-spot incident can cost more than a mid-level engineer's monthly salary.
- Google's DORA (DevOps Research and Assessment) research shows elite-performing teams restore service in under an hour, while low performers often take more than a week — and the difference is rarely raw talent, it's instrumentation.
- Observability is not an enterprise-only investment. A single well-placed tracing layer can save a five-person startup from a churn-triggering outage just as easily as it saves a Fortune 500 company.
- AEGONTECH LLC builds observability into client architecture from the first sprint, not as a post-incident retrofit, across every product we ship — from Dolfy.ai to Mimicall.app.
What Is Observability, and Why Isn't Monitoring Enough?
Observability is the ability to ask new, previously unanticipated questions about your system's internal state without shipping new code to answer them; monitoring is the practice of watching a predefined set of metrics against known thresholds. The distinction matters because monitoring can only tell you about failure modes someone already thought to measure. Observability, built on three pillars — logs (timestamped records of discrete events), metrics (numeric measurements aggregated over time, like request latency or error rate), and traces (the end-to-end path of a single request across services) — lets an engineer reconstruct what happened even when the failure was never anticipated.
This matters more as systems get more distributed. A monolith (a single deployable application containing all business logic) fails in fairly predictable ways: the process crashes, the database connection pool exhausts, the disk fills up. A microservices architecture (a system decomposed into many independently deployable services that communicate over a network, typically through an API gateway — a single entry point that routes, authenticates, and rate-limits requests to backend services) fails in combinatorial ways: service A is slow because service B is retrying against a degraded service C, and no single dashboard shows that chain. Reactive monitoring versus proactive observability isn't a matter of semantics here — it's the difference between an on-call engineer staring at five separate tools trying to correlate timestamps by hand, and an engineer running one trace query that shows the entire request path in seconds.
Why Do Most Teams Only Discover Their Blind Spots During an Incident?
Because instrumentation is invisible until the moment it's needed, and it competes for sprint time against features that are visible immediately. Under Agile or Scrum planning (iterative frameworks that break work into short, reviewable cycles), observability work rarely has a visible "customer value" story, so it loses prioritization fights against the next feature — right up until the outage that erases weeks of that feature's business value in a single afternoon.
There's also a technical debt dimension here. Technical debt (the implied future cost of choosing a quick, expedient solution over a more thorough one) usually gets discussed in terms of code quality or architecture, but instrumentation debt is a specific, underappreciated subtype: every service shipped without structured logging, without a correlation ID threading through its calls, without a defined Service Level Objective (SLO — a target for how reliable a service should be, like "99.9% of requests complete in under 300ms") is a small loan against a future incident review. The interest on that loan is paid in mean time to resolution (MTTR — the average time from when an incident starts to when it's fixed), and it compounds.
You cannot fix what you cannot see, and you cannot see what you never instrumented. That's not a slogan — it's the single most common root-cause finding in postmortems across the industry, AEGONTECH's included.
Which Signals Actually Predict Failure Before It Happens?
The signals that predict failure are almost never the ones on the default dashboard — they're saturation trends (how close a resource is to its limit), error budget burn rate (how fast a service is consuming its allowed margin of failure within an SLO period), and tail latency (the p95 or p99 response time, which reveals problems the average hides). A service can have a perfectly healthy average response time while its 99th percentile — the experience of your most valuable, highest-volume customers — is quietly degrading for days before it tips into a full outage.
Distributed tracing is the single highest-leverage investment most teams haven't made. Industry benchmarks from observability vendors consistently show 40-60% reductions in MTTR for cross-service failures once teams adopt tracing, simply because engineers stop guessing which of a dozen services is the actual bottleneck. Pair that with structured logging (logs emitted as machine-parseable key-value data rather than free-text strings) and container-level metrics from Docker or Kubernetes (the containerization and orchestration platforms most modern deployments run on, whether hosted on AWS, Azure, or GCP), and a team goes from "we think it's the database" to "here is the exact query, on this pod, at this timestamp" in the same incident window.
How Does AEGONTECH Build Observability Into Client Systems From Day One?
We treat instrumentation as a first-class deliverable in the same CI/CD pipeline (Continuous Integration/Continuous Deployment — the automated process that builds, tests, and ships code changes) that ships the feature itself, not a follow-up ticket. On EmolyTicks, our support and ticketing product, every request carries a correlation ID from the moment it hits the API gateway through to the database write, so a support engineer can trace a single customer's ticket lifecycle without paging a developer. On Mimicall.app, real-time call quality metrics are treated with the same SLO discipline as uptime, because for a communications product, "the app is up" and "the call sounded good" are entirely different reliability questions — and only one of those variables shows up if you only monitor server health.

Dolfy.ai and Dialable.world, both of which depend on third-party API integrations, get particular attention on tracing across service boundaries — because when something fails and the root cause lives inside a vendor's system rather than ours, distributed tracing is the only way to prove that quickly and avoid days of finger-pointing. Maximus IPTV Player, streaming to end users across variable network conditions, needs client-side telemetry as much as server-side metrics, since the failure the user experiences (buffering, dropped frames) frequently never touches AEGONTECH's own infrastructure at all.
Is Observability Worth the Investment for a Startup, or Only for Enterprise Systems?
It's worth it earlier than most founders assume, because the cost of adding instrumentation to a system with ten services is a fraction of retrofitting it onto a system with a hundred. The best time to build an observability practice is before you need it; the second-best time is during the incident that just proved you needed it yesterday. A startup running a lean stack on serverless infrastructure (compute that runs your code without you provisioning or managing servers, common on AWS Lambda or comparable GCP/Azure offerings) still generates logs, metrics, and traces — the discipline costs engineering time, not infrastructure spend, and that time is cheaper before a system has customers depending on it around the clock.
Cost optimization on AWS is often framed purely as a billing exercise, but observability data is one of the most underused levers for it: teams that can see exactly which service, query, or code path is consuming compute make far more targeted optimization decisions than teams cutting instance sizes and hoping. Good observability doesn't just shorten incidents — it's one of the few engineering investments that pays for itself in both reliability and cloud spend simultaneously.
Security posture benefits too. Under frameworks like OWASP's guidance (the Open Web Application Security Project, a widely referenced standard for web application security) and SOC 2 compliance (a security and availability audit standard many B2B software vendors are required to hold), auditors increasingly expect demonstrable logging and traceability of access to sensitive data — not just a firewall rule and a hope. Observability infrastructure and compliance infrastructure overlap far more than most teams realize when they budget for them separately.
Frequently Asked Questions
What's the difference between monitoring and observability in practical terms? Monitoring answers questions you already thought to ask ("is CPU above 80%?"); observability lets you answer questions you didn't anticipate needing to ask, by preserving enough structured context — logs, metrics, and traces — to reconstruct what happened after the fact.
Do we need a dedicated platform like Datadog or an open-source stack to get started? No — teams can start with open-source tooling (Prometheus for metrics, OpenTelemetry for traces, structured JSON logging) running alongside a React or Next.js frontend and a Node.js or Python backend, and graduate to a commercial platform once the data volume or team size justifies the operational overhead of running it yourself.
How long does it typically take to retrofit observability onto an existing system? It depends on the number of services and how much structured logging already exists, but AEGONTECH typically sees meaningful visibility improvements — correlation IDs, basic tracing, SLO dashboards — within 4-6 weeks for a mid-sized system, with full maturity taking a quarter or more.
Is this only relevant for backend systems, or does it apply to databases too? It applies everywhere data moves, including the database layer. Whether a team is running PostgreSQL (a relational database well suited to transactional, structured data like billing or ticketing) or MongoDB (a document database suited to flexible, evolving schemas like chat logs or content), query-level observability is often the fastest way to find the actual bottleneck behind a "the app feels slow" complaint.
Closing Thoughts
The teams that handle incidents calmly aren't the ones with the best luck — they're the ones who invested in seeing their systems clearly before they had to. That's true whether you're running a five-service startup MVP or a mature enterprise platform, and it's a discipline, not a purchase. If your team is evaluating a software development partner who treats instrumentation as core architecture rather than an afterthought, AEGONTECH LLC builds that discipline into every engagement from day one — reach out for a consultation if you'd like a second set of eyes on where your own blind spots might be.